
The Quanton Blog
Engineering deep-dives, guides, and product news from the people building Quanton.
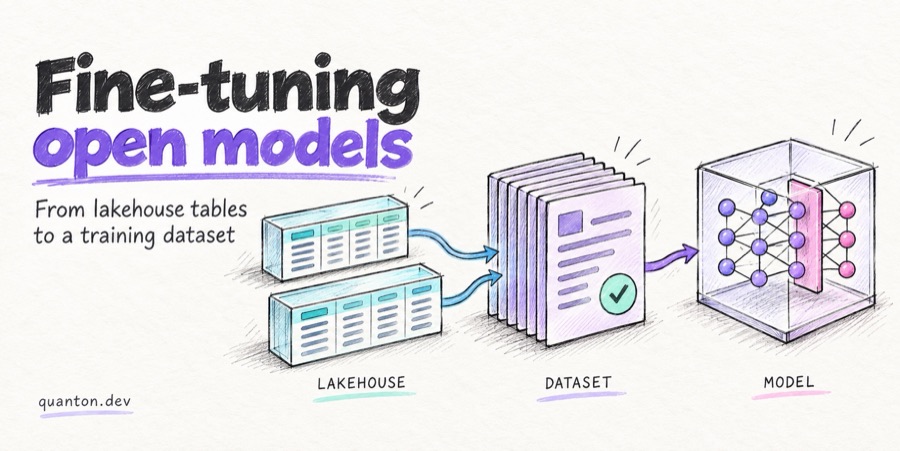
Fine-Tuning Open Models: From Lakehouse Tables to a Training Dataset
Fine-tuning changes how a model behaves, and RAG changes what it answers from. This guide covers what fine-tuning is and the kinds you will meet: LoRA against full weights, and SFT against preference tuning and continued pretraining. It then covers where you run the job, either with an open-source trainer on your own GPUs or on a managed platform. Finally it builds the dataset itself in SQL from the Hudi tables that the previous guide produced. The exporter validates that dataset against the trainer's schema before anything is written, versions it so that every run stays reproducible, and writes a manifest naming the exact command that loads it.
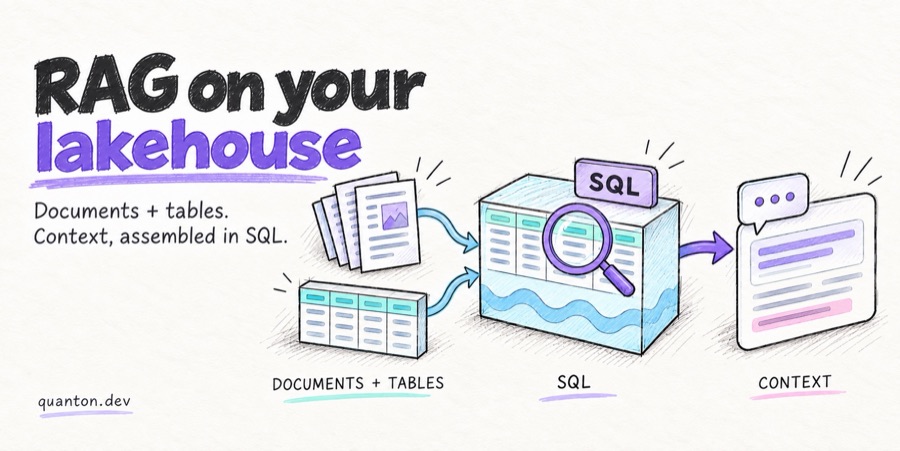
RAG on Your Lakehouse: Serve Context From Structured and Unstructured Data in SQL
Your object storage holds structured data such as fact tables, exports and CDC feeds, and unstructured data such as PDF, TXT, MD and HTML files. Many teams keep those files on a NAS and read them through an object-storage client. This guide reads both kinds with one engine, and it parses contracts from the CUAD dataset on Hugging Face into Hudi tables that hold the chunks and the embeddings. One SQL query then answers a question, mixing filter, join and aggregate with vector similarity in the same plan.
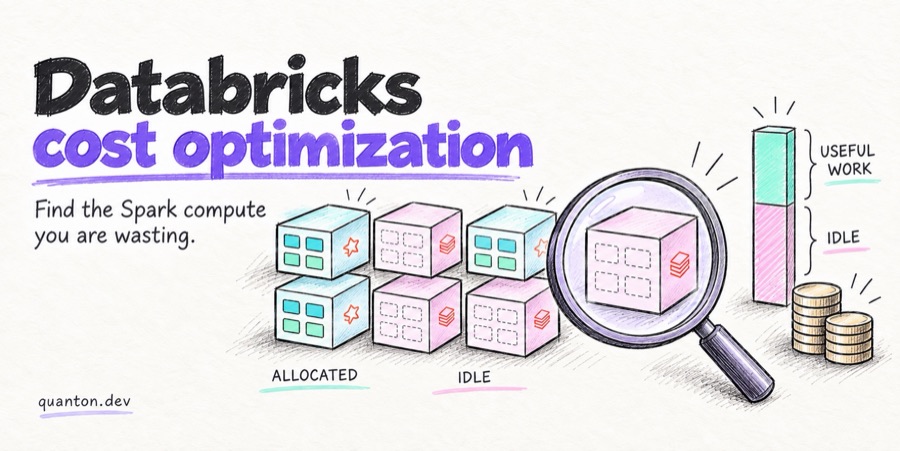
Databricks Cost Optimization: How to Find the Spark Compute You're Wasting
Most Databricks cost optimization work starts in the wrong place: the bill. The bill tells you what you spent, not what you wasted. In practice, a large share of Spark and Databricks spend goes to over-provisioned or idle executors, dynamic-allocation churn, spill, GC, stragglers, retries, and speculative duplicates — each has a Spark UI signature you can find, and the free spark-analyzer tool measures how much of your allocated compute is wasted.
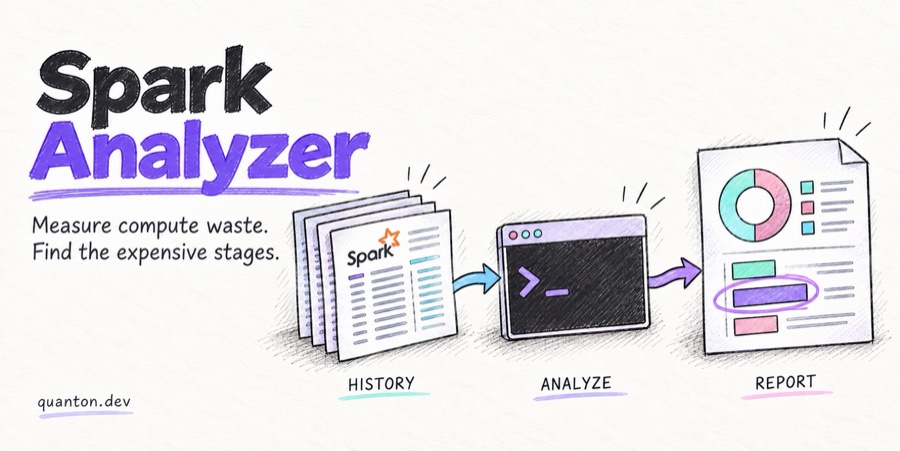
Spark Analyzer: Put a Number on Your Wasted Spark Compute, for Free
Spark Analyzer is a free CLI from Onehouse — pip install spark-analyzer — that reads your Spark History Server and reports, per application, how much of your allocated compute did useful work, how much was wasted, and what each stage was actually doing. We pointed it at four deliberately broken Spark jobs: the skewed one was wasting 40.8% of its compute.
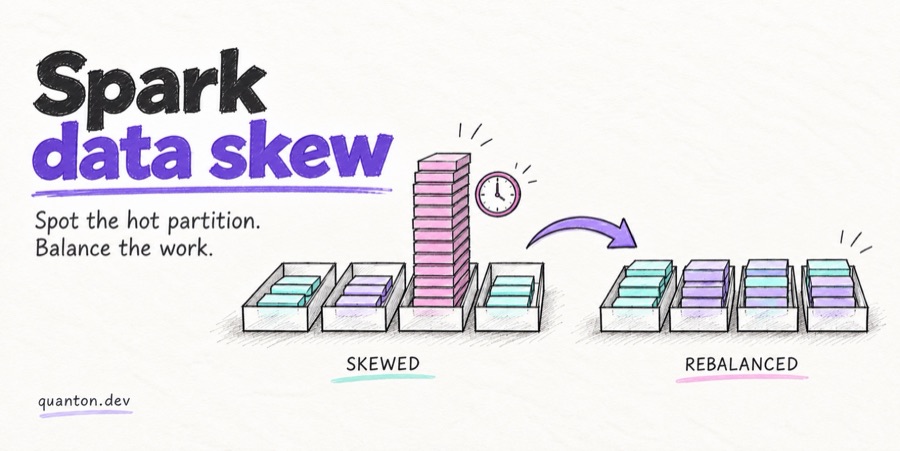
Spark Data Skew: How to Detect It and Fix It
Spark data skew is when a few partitions carry far more data than the rest, so 199 tasks finish in seconds and one runs for an hour. It's the #1 reason a Spark job gets stuck at the last task, and it's visible in the task-duration distribution of the Spark UI.
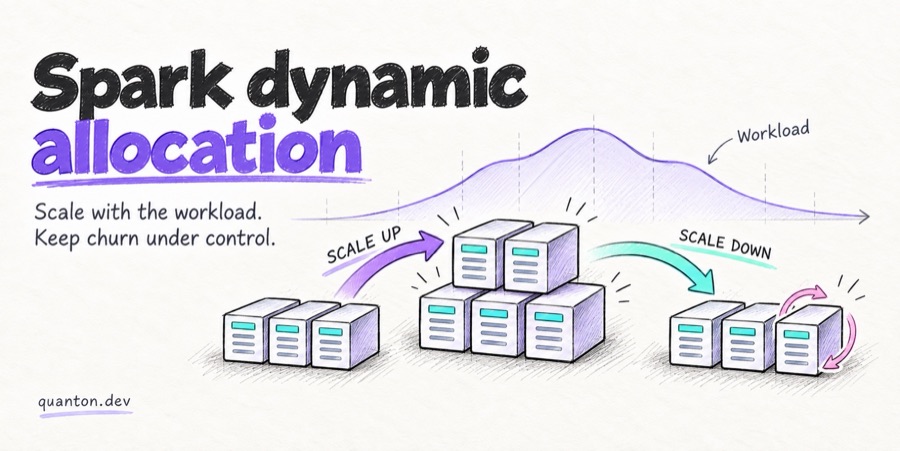
Spark Dynamic Allocation: How It Works, When It Backfires, and How to Tune It
Spark dynamic allocation adds and removes executors based on the pending task backlog — it saves money on bursty workloads but backfires as executor churn, shuffle refetch, and clusters that never scale down. Here's how the request and release policies actually work, how to tune the configs that matter, and how to measure what the autoscaler is really costing you.
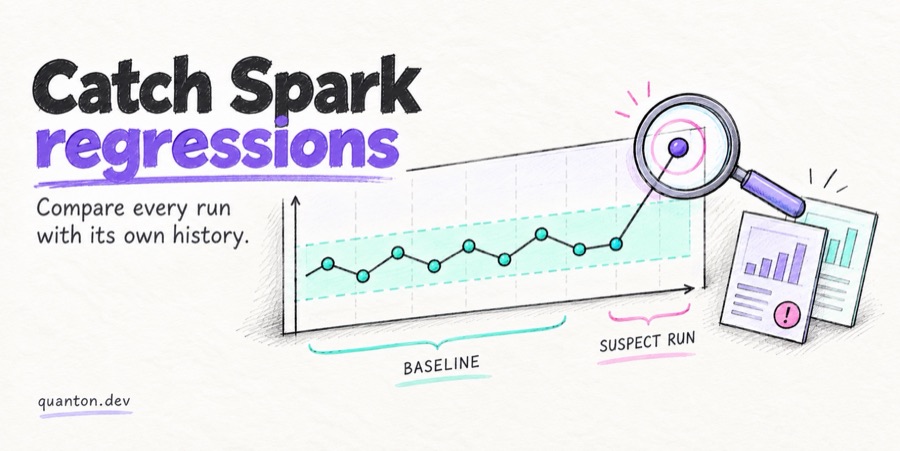
How to Catch Spark Performance Regressions Across Runs
Spark performance regressions hide inside run-to-run variance — a job that swings ±20% between runs can absorb a 30% regression for weeks before anyone notices. The fix is baselining every run against its own history (P50/P95) — the Spark History Server already records everything you need, and once a run is flagged, the Quanton agent turns it into a diagnosis.
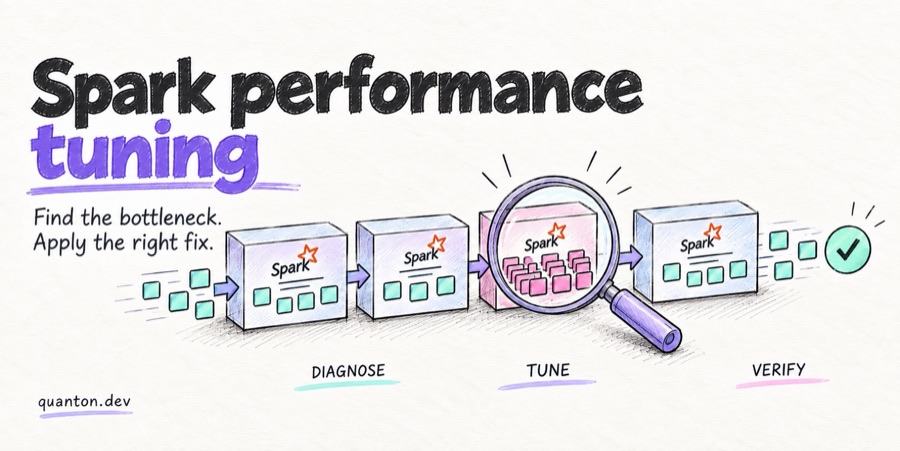
Spark Performance Tuning: Why Is Your Apache Spark Job Slow — and How Do You Fix It?
Almost every slow Apache Spark job comes down to one of six causes: data skew, shuffle, spill, GC pressure, small files, or a bad query plan. Spark performance tuning starts with identifying which one is hurting your live run — not guessing configs. The Quanton AI agent, embedded in the Spark UI, pinpoints the cause automatically from the running job.
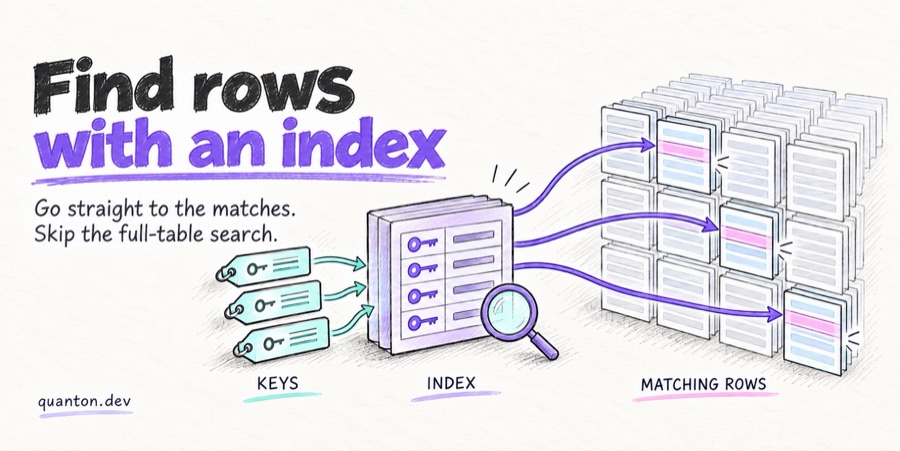
You're Updating 1M Rows. Why Scan 100 Billion to Find Them?
A JOIN or MERGE has to find the target rows that match your source keys. Spark tries to prune the target with dynamic partition pruning, but when updates land randomly across a large fact table it barely helps, so it falls back to scanning and shuffling most of the table. Quanton asks an index instead, mapping each key to the exact file and row position so the engine reads only the row groups that actually match.
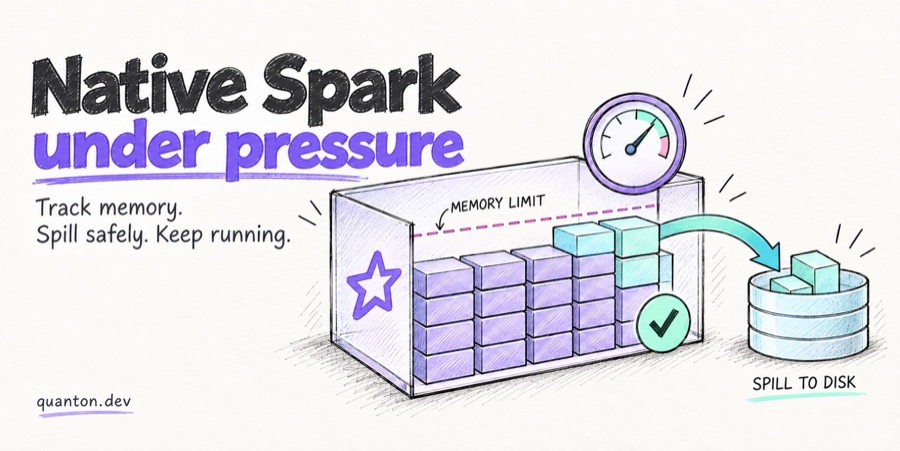
Why Native Spark Accelerators Get OOMKilled, and How Quanton Runs Reliably Under Memory Pressure
Native Spark accelerators move most of a query's working set out of the JVM heap and into off-heap native memory — and that is exactly where they tend to get OOMKilled. The surprising part is that the engine often frees its memory correctly; the kill happens anyway. Quanton is built to track live memory accurately, avoid fragmentation and spill under pressure instead of dying.
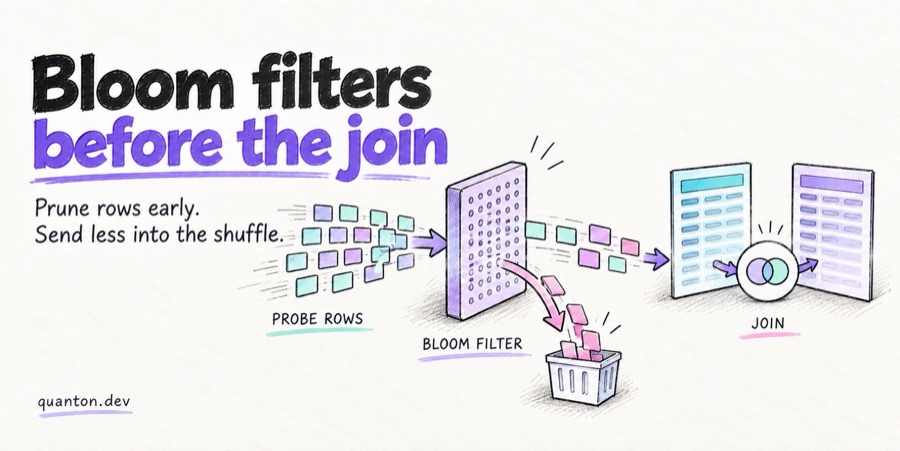
Bloom Filters Before the Join: How Spark Prunes Probe Rows — and How Quanton Makes It Native
Spark applies Bloom filters to large fact tables before joining them with dimension tables, reducing the amount of data that must be shuffled and joined. Quanton preserves Spark's Bloom filter injection strategy while accelerating filter evaluation through vectorized execution.
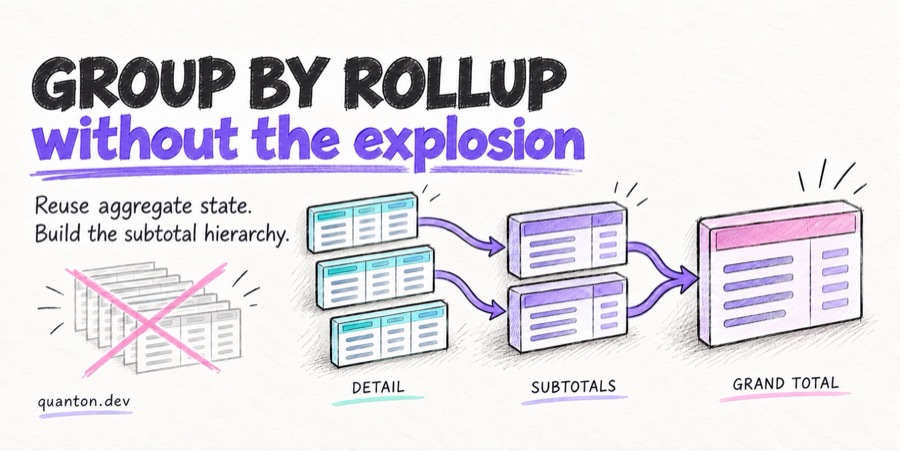
GROUP BY ROLLUP Without the Row Explosion
ROLLUP is how SQL computes subtotals and grand totals in one query. Spark executes it by exploding every input row into N+1 copies before aggregating — a tax that grows with the depth of the rollup. Quanton replaces that with a rollup operator that re-aggregates already-collapsed state, removing the input-side explosion.
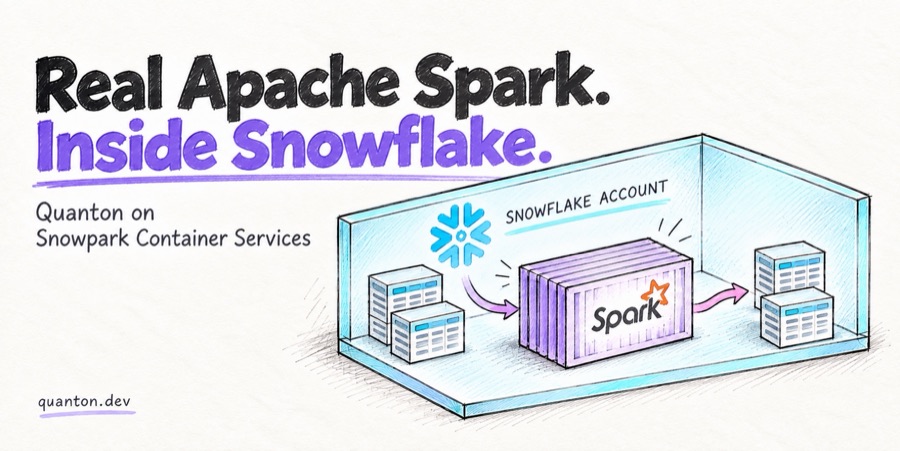
Real Apache Spark. Inside Snowflake.
We talked with 1,200+ data engineers at Snowflake Summit and Databricks Data+AI Summit. Only 15% of Snowflake users are on Iceberg. We think that's about to change. Today we're shipping Quanton on SPCS: real Apache Spark inside your Snowflake account, 2-5x better price/performance than Databricks with Photon, 63% fewer credits burned.
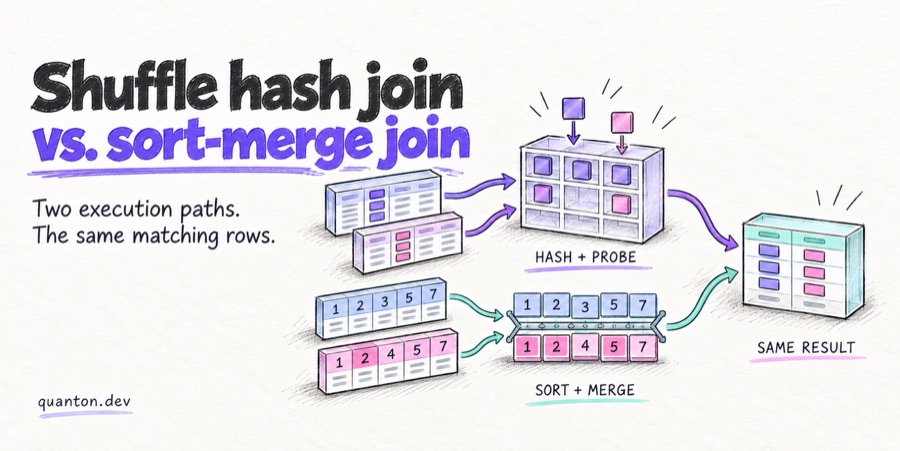
Shuffle Hash Join vs. Sort-Merge Join: How Modern Engines Execute Equi-Joins
SHJ and SMJ produce identical results but make opposite bets on CPU, memory, and data layout. A deep dive into how vectorized engines implement both — adaptive hash-table layouts, SIMD tag probing, normalized keys — and why Quanton defaults to a vectorized SHJ.
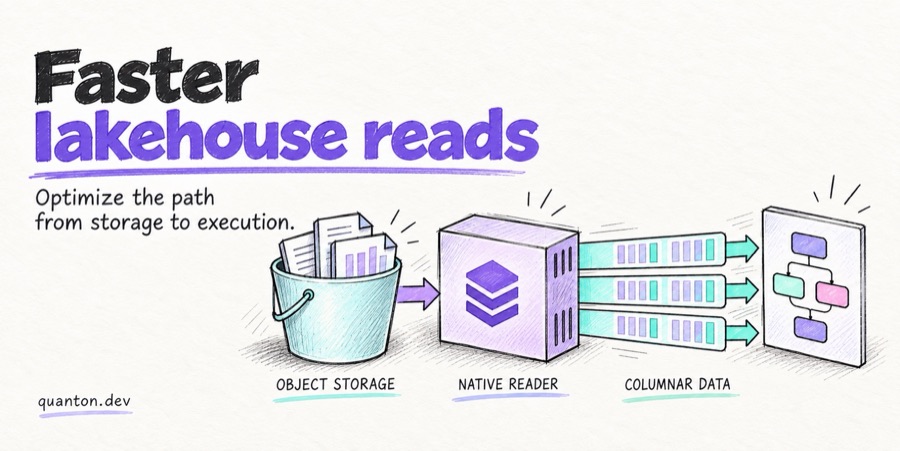
Accelerating Lakehouse Reads with Quanton Engine
High and unpredictable object-store access latencies, compute-intensive Parquet decoding, and shuffle preparation can dominate Spark job runtimes. Quanton is built to optimize this critical first mile.
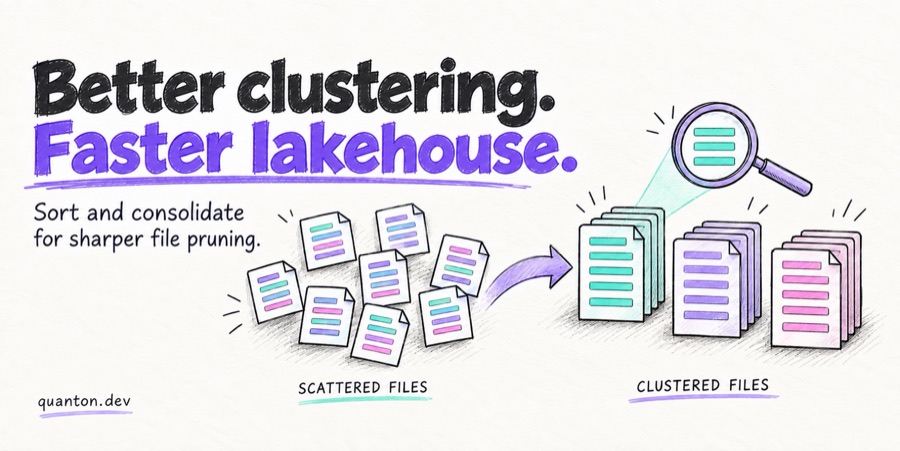
Why Clustering Matters — and Why We Just Made It 4× Faster
Clustering fixes the two file-layout problems every data team hits: too many files scanned, and small files piling up. The catch is that the sort-and-rewrite isn't free. Quanton ships a native execution path for clustering on Hudi and Iceberg.
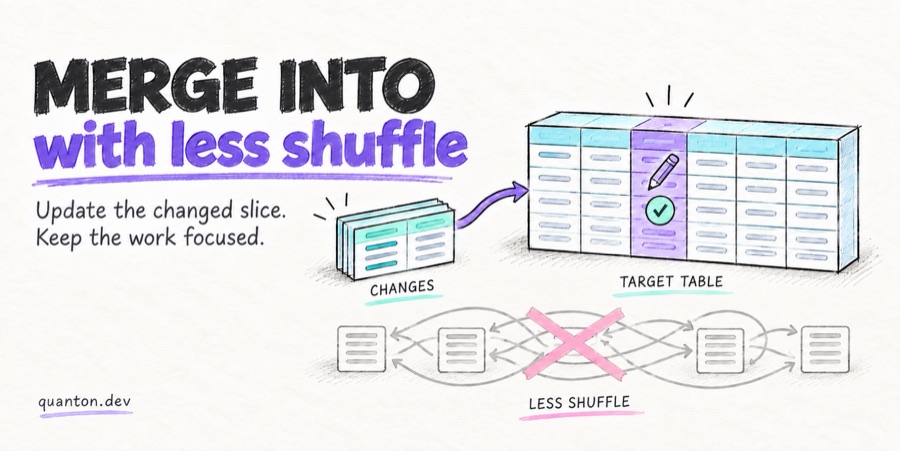
MERGE INTO Updates a Slice of Your Table — So Why Shuffle All of It?
A typical MERGE updates a tiny fraction of rows, yet OSS Apache Spark + Apache Iceberg shuffles the entire target table. Here's the shape of that pain — and the low-shuffle columnar MERGE path Quanton uses instead.
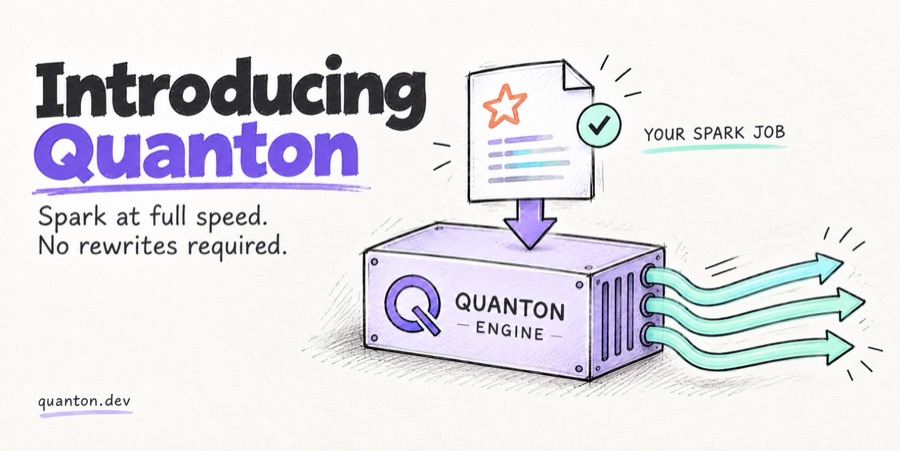
Introducing Quanton: Spark at Full Speed
Today we're launching Quanton, a drop-in compute engine that makes your Apache Spark workloads dramatically faster — no rewrites required.
No posts match .
