
Overview
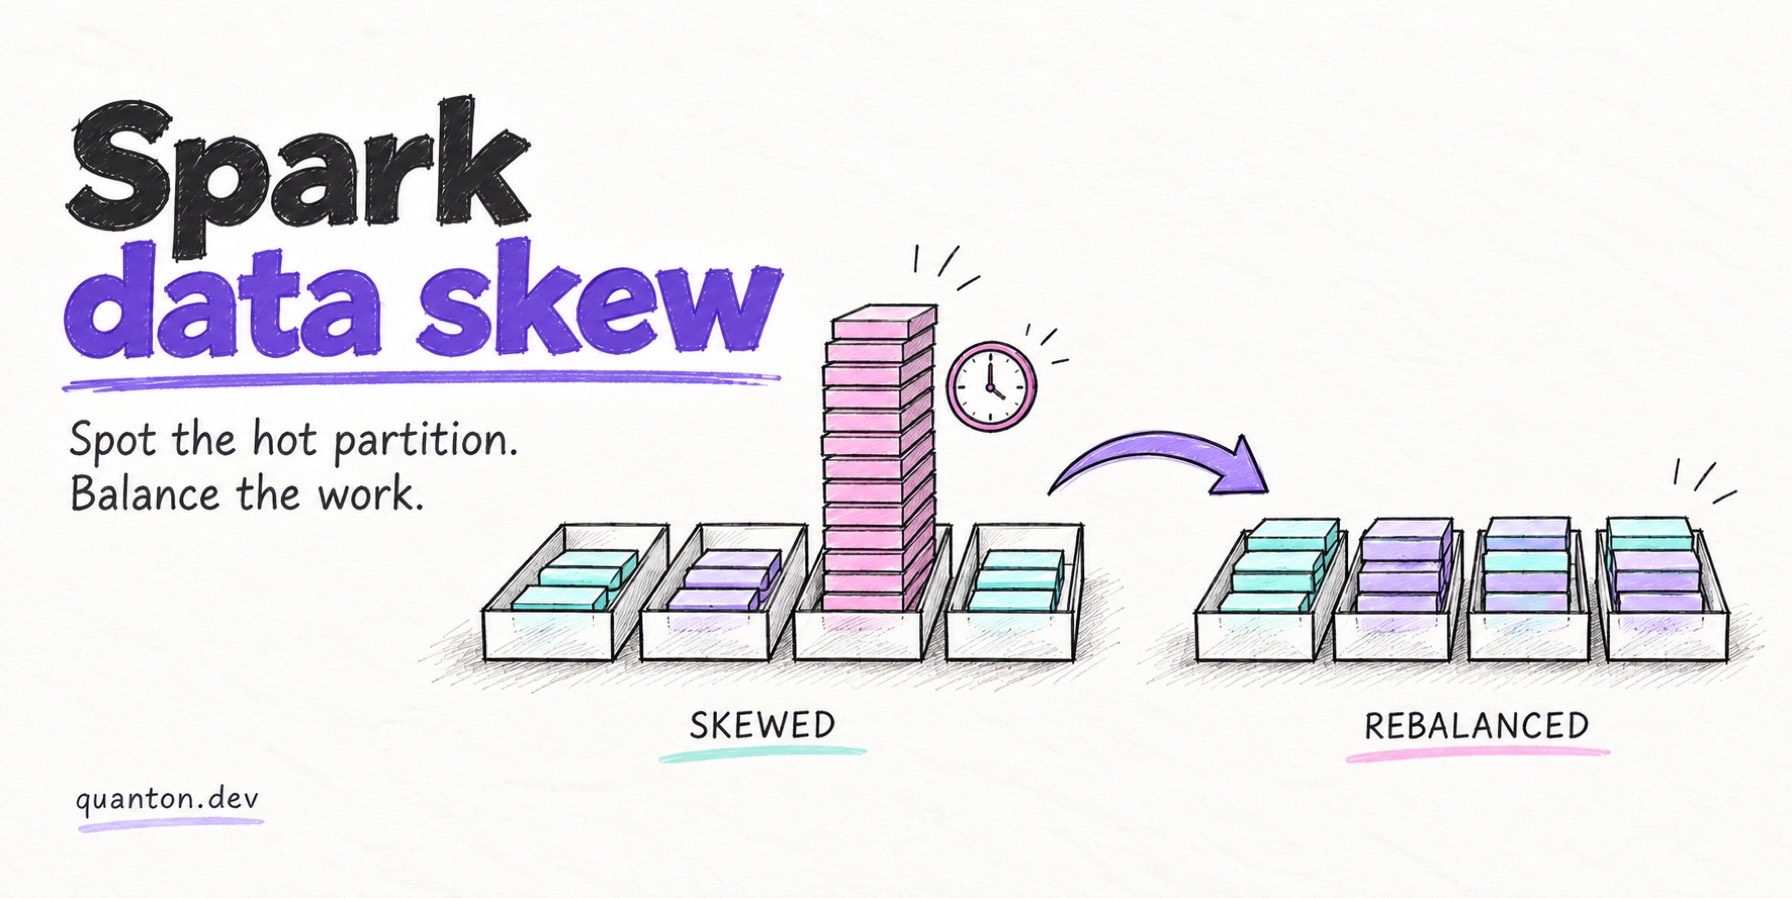
Spark data skew is the single most common reason a job that “should be parallel” isn’t. One partition ends up holding most of the data, one task ends up doing most of the work, and your 200-core cluster spends an hour doing what is effectively single-threaded execution — while you pay for all 200 cores.
This post covers what skew is, how to spot it in the Spark UI in under a minute, how to tell it apart from look-alike problems, and five fixes ranked by when to use them. It’s part of our broader Spark performance tuning guide.
What is data skew in Spark?
Data skew is an uneven distribution of rows across partitions after a shuffle. Spark assigns each row to a partition by hashing its key — and hashing is fair to keys, not to rows. If one key value holds 40% of your rows, one partition holds 40% of your data, no matter how many partitions you have.
Hot keys almost always come from one of three places:
- Nulls. Unmatched rows in an outer join, missing values in a fact table. Every null hashes to the same partition.
- Defaults.
0,-1,"unknown",""— placeholder values that quietly accumulate millions of rows. - Power-law IDs. Real-world entities are Zipf-distributed: one viral post, one whale customer, one mega-tenant can carry orders of magnitude more events than the median.
Skew hits anything that shuffles by key: joins, groupBy aggregations, and window functions with a PARTITION BY clause. A select or filter doesn’t shuffle, so it doesn’t care about key distribution. The moment a shuffle enters the plan, key distribution becomes your stage’s critical path.
How do I detect data skew in Spark?
Open the slow stage in the Spark UI and look at the Summary Metrics table: if the max task duration is many times the median, and shuffle read size is lopsided the same way, you have skew. That’s the whole diagnosis — a skewed stage has a distinctive fingerprint that takes seconds to read.
Three places to look, in order:
1. Spark UI, stage view. The summary metrics table shows min / 25th / median / 75th / max for duration and shuffle read size. Healthy stage: max is within ~2× of median. Skewed stage: max duration and max shuffle read are both 10–1000× the median, and they’re the same task. The task table (sort by duration, descending) shows you exactly which partition got the hot key.
2. SQL — count rows per key. Once the UI tells you that a stage is skewed, SQL tells you which key did it:
SELECT customer_id, COUNT(*) AS cnt
FROM events
GROUP BY customer_id
ORDER BY cnt DESC
LIMIT 20;
If the top row is 1,000× the 20th row, that’s your hot key. Run it with customer_id IS NULL broken out separately — nulls are the most common hot key and the easiest to miss.
3. Automatically. The Quanton agent, embedded in the Spark Web UI with no job code changes, watches for this pattern continuously. Live Monitor tracks a per-stage skew ratio (max vs. median task duration) at a 2-second refresh, and the Diagnostics panel raises a dedicated data skew alert that names the offending stage — so the fingerprint above is flagged for you while the job is still running, not discovered in a post-mortem.
Why is my Spark job stuck on the last task?
Because one task got the hot partition. “Stuck at the last task” — the progress bar showing 199/200 for an hour — is the classic presentation of data skew: 199 partitions were small and finished in seconds; the 200th holds the hot key and is processing most of the stage’s data alone.
But not every last-task hang is skew. Three look-alikes:
| Symptom | Slow task’s shuffle read | Likely cause |
|---|---|---|
| One task, huge input | Far above median | Data skew — hot key |
| One task, normal input, slow anyway | Near median | Bad node / straggler — throttled disk, noisy neighbor, failing hardware |
| One task, normal input, high GC time | Near median | GC pressure — memory config, not data distribution |
The distinguishing metric is input size. Skew means the slow task read more data. A straggler or GC victim read a normal amount and was slow anyway. Salting a GC problem fixes nothing; resizing executors for a skew problem fixes nothing — so check shuffle read bytes before choosing a fix.
This is exactly the separation the Quanton agent’s Diagnostics makes: data skew, straggler tasks, and GC pressure are distinct alerts, classified from task metrics (shuffle read, duration distribution, GC time). You can also ask directly — the agent’s chat has the full job context (stages, tasks, SQL plans, executor logs), and /spark-debugger will walk the classification for you.
How do I fix data skew in Spark?
Match the fix to the shape of the skew. There are five standard techniques:
1. AQE skew-join handling. Spark 3.x’s Adaptive Query Execution detects oversized shuffle partitions at join time and splits them into sub-partitions, each joined against a duplicated copy of the matching partition on the other side:
spark.sql.adaptive.enabled=true
spark.sql.adaptive.skewJoin.enabled=true
spark.sql.adaptive.skewJoin.skewedPartitionFactor=5
spark.sql.adaptive.skewJoin.skewedPartitionThresholdInBytes=256m
Both are on by default since Spark 3.2 — a partition is split when it’s both 5× the median and over 256 MB. When it helps: skewed sort-merge or shuffled hash joins, which is the majority of real-world skew. When it can’t: aggregations and window functions (there’s no “other side” to replicate), and it splits partitions, not keys — the mitigation is bounded when a single key dominates and the downstream operator needs all of that key’s rows together.
2. Salting. The manual, general-purpose fix. Append a random salt to the hot key on the big side so it spreads across N partitions, and explode the small side N ways so every salted variant finds its match:
-- Big side: scatter the hot key across 16 partitions
SELECT concat(f.customer_id, '_', cast(floor(rand() * 16) AS int)) AS salted_key, f.*
FROM fact f;

-- Small side: replicate each row 16 times to cover every salt
SELECT concat(d.customer_id, '_', s.salt) AS salted_key, d.*
FROM dim d
LATERAL VIEW explode(sequence(0, 15)) s AS salt;

-- Join on salted_key instead of customer_id
Works on joins and (with a two-phase partial-then-final aggregate) on groupBys. Cost: the small side’s rows are duplicated N×, and your query gets uglier. Salt only the hot keys — not the whole table — if you can enumerate them.
3. Broadcast the small side. If one side of the join fits in executor memory, broadcast it (/*+ BROADCAST(dim) */ or raise spark.sql.autoBroadcastJoinThreshold). No shuffle means no shuffle partitions means no skewed partitions — the problem doesn’t get fixed, it gets deleted. See our shuffle hash join vs. sort merge join deep dive for how join strategy selection works. When broadcast isn’t possible, Bloom filters before the join can still cut the shuffled volume dramatically.
4. Filter or segregate hot keys. Nulls especially: rows with a null join key can’t match anything in an inner join — filter them before the shuffle instead of shuffling them into one giant partition. For legitimate hot keys, split the query: process the hot keys through a broadcast path, everything else through the normal shuffle, and union the results.
5. Repartition on a better key. If the skew is in an aggregation and a composite key preserves your semantics (customer_id, date instead of customer_id), repartitioning on it spreads the hot key naturally. Only valid when downstream logic doesn’t require all of a key’s rows in one partition.
| Technique | When to use | Cost |
|---|---|---|
| AQE skew join | Skewed SMJ/SHJ joins, Spark 3.x | Near-zero — usually already on |
| Salting | Aggregations; extreme single-key join skew AQE can’t split | Small side duplicated N×; query complexity |
| Broadcast join | One side fits in executor memory | Driver/executor memory; small side only |
| Filter/segregate hot keys | Null keys; a few known hot keys | Extra query branch + union |
| Repartition on better key | Composite key preserves semantics | A shuffle; only if logic allows |
Start with AQE (confirm it’s actually engaging — the SQL tab shows split skewed partitions), broadcast if the small side allows it, and reach for salting when neither applies.
What does skew actually cost?
A stage finishes when its slowest task finishes — so with skew, whole-stage wall time equals the hot task’s runtime, and every other executor slot you’re paying for idles until it’s done. If 199 tasks finish in 30 seconds and one runs for an hour, you’re paying for an hour of cluster time to get roughly one core’s worth of work in the tail.
That waste is measurable, not hand-wavy. The straggler tax falls out of the stage summary metrics directly: (max task duration − median) × the other executor slots in the stage is the idle capacity everyone burned waiting on the hot task. At the application level, the free spark-analyzer CLI reports it as a compute waste percentage — our deliberately skewed demo job measured 40.8% waste against 59.2% efficiency. These are executor-seconds and percentages, not dollars: multiply by your hourly executor rate to get your own dollar estimate. On a chronically skewed daily job, that number is usually the strongest argument you’ll ever have for spending an afternoon on salting.
Skewed jobs are also a big, quiet line item on managed platforms, where every idle executor-hour is billed at a premium — more on that in our Databricks cost optimization guide.
How do I measure skew’s cost across all my jobs?
Point Spark Analyzer — Onehouse’s free CLI — at your Spark History Server. Its per-application report shows what share of allocated compute did useful work versus sat idle (idle is exactly what a straggler produces: every other core waiting), and the stage-level sheet pins the waste to the specific stage the hot key dominated.
pip install spark-analyzer
spark-analyzer configure          # point it at your Spark History Server
spark-analyzer analyze --save-local
It runs locally, and --save-local keeps all data in your environment. See the Spark Analyzer walkthrough for what the report looks like on a deliberately skewed job.
Takeaway
Skew is a data-distribution problem wearing a performance-problem costume. Diagnose it from the task-duration and shuffle-read distribution (max ≫ median), confirm the hot key with a GROUP BY ... ORDER BY count DESC, and fix it with the cheapest technique that fits: AQE for skewed joins, broadcast when the small side fits, salting when nothing else applies, and a hard look at your nulls either way. And if you’d rather not eyeball histograms, the Quanton agent flags skew — with the offending stage, separated from stragglers and GC — while the job is still running.
