
Overview
Databricks cost optimization usually starts with the invoice and ends with a spreadsheet of clusters ranked by spend. That ranking tells you where money goes, not which part was wasted. The waste hides inside the jobs: executors that sat idle, memory that spilled to disk, JVMs stuck in GC, tasks that ran twice, stages that reran after a fetch failure.
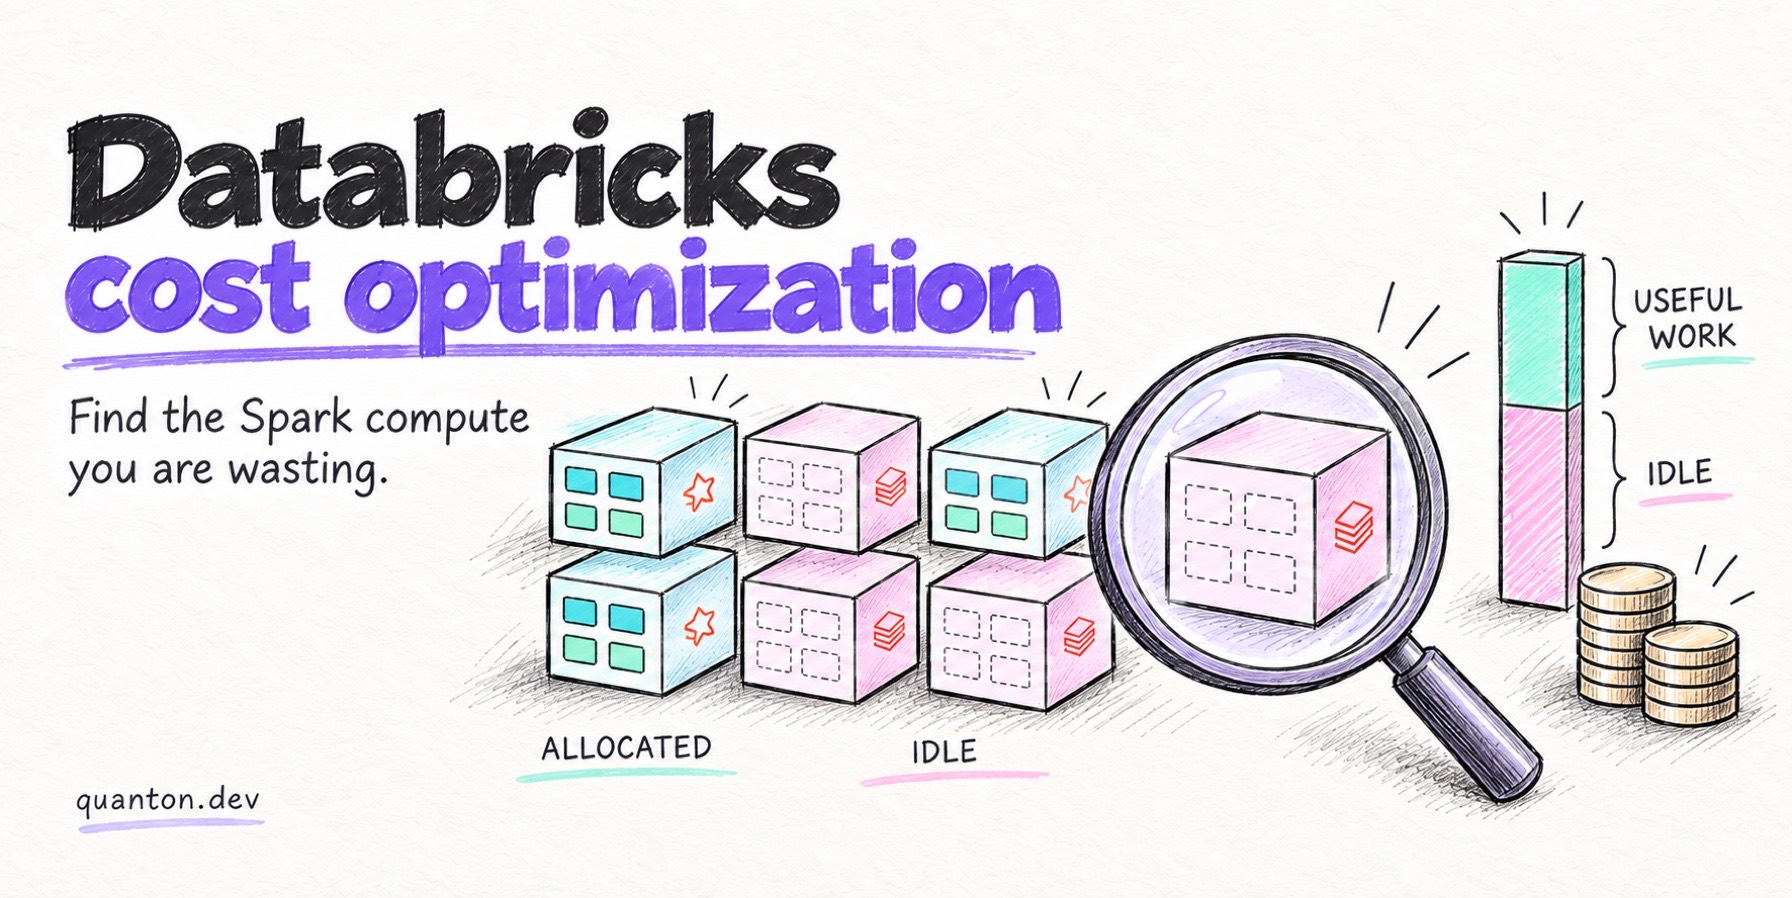
Every one of those has the same unit of wastage: executor-seconds. Your bill, whether it’s DBUs on Databricks or EC2 hours on EMR, is a linear function of executor-seconds. To reduce your bill, reduce the executor seconds needed.
Two free instruments measure it, and both work on Databricks, EMR, Dataproc, Fabric, or plain OSS Spark: the Spark UI for per-job forensics, and the spark-analyzer CLI for the aggregate accounting — it reads your Spark History Server and reports, per application, what share of allocated compute did useful work and what share was wasted. Everything in this post is stated in executor-seconds and percentages, not dollars: to turn any finding into money, multiply by your own hourly executor rate (instance $/hr × DBU or EMR uplift, ÷ 3600). No dollar figure in this post is invented — and you shouldn’t trust one from anyone who doesn’t know your rates.
Here’s the map — each waste category with its Spark UI signature and fix:
| Waste category | Symptom in the Spark UI | Typical fix |
|---|---|---|
| Over-provisioning | CPU utilization low all job | Fewer/smaller executors |
| Idle executors | Executors with ~0 task time | Fix parallelism gaps, tune idle timeout |
| Dynamic-allocation churn | Executors added/removed in waves | Tune up/down thresholds, cached/shuffle timeouts |
| Stragglers | Max task ≫ median task | Speculation (carefully), fix slow nodes |
| Data skew | One partition dominates a stage | AQE skew join, salting, repartition |
| Spill | Spill (Memory/Disk) > 0 on stages | More partitions, more memory per core |
| GC overhead | GC time > ~10% of task time | Smaller heaps × more executors, off-heap |
| Speculative waste | Tasks killed “another attempt succeeded” | Fix root cause of slowness first |
| Retries / failures | Failed tasks, stage reattempts | Fix OOMs, fetch failures, flaky deps |
The rest of this post is Spark cost optimization at the job level. For each group: symptom, why it burns money, how to confirm it in the Spark UI, how to measure it, and the fix.
Why is my Spark cluster underutilized?
A Spark cluster runs at low CPU utilization when you provisioned for the widest stage of the job and every other stage runs far below that width. The compute is billed the whole time; it’s only used during the peaks.
Why it burns money. A 40-executor cluster whose average occupancy is 12 executors pays a ~70% tax on every hour. This is the largest waste bucket in most jobs because it’s structural: scan stages are wide, aggregation stages are narrow, and driver-only phases (planning, commit, table metadata work) use zero executors while all of them bill.
Confirm it in the Spark UI. In the Executors tab, compare each executor’s Task Time to its uptime. An executor up for an hour with ten minutes of task time is idle billed compute; the Jobs-page event timeline shows the same gaps visually.
Fix. Right-size to the sustained parallelism, not the peak — a slightly longer wide stage on fewer executors is almost always cheaper than idle metal. Enable dynamic allocation so the cluster tracks the workload (failure modes below).
How to measure it. Total task time ÷ total executor uptime across the Executors tab is the job’s real utilization; everything below 100% is billed idleness. spark-analyzer computes exactly this from your History Server, per application — its report states resource efficiency and compute waste as percentages, so you can rank every job in the fleet by how much of its allocation it actually used.
Why is my Databricks cluster not scaling down?
Autoscaling fails to scale down when something pins executors alive: cached RDD/DataFrame blocks, shuffle files a future stage might read, or a trickle of small tasks that resets the idle timer just before it fires.
Why it burns money. Dynamic allocation is supposed to fix over-provisioning. When it can’t release executors, you get autoscaler up behavior with static-cluster down behavior. Worse, scale-down that immediately triggers scale-up (“churn”) pays executor startup cost — JVM boot, container scheduling, cache warmup — over and over.
Confirm it in the Spark UI. The Executors tab shows removed executors with reason strings; a sawtooth of adds and removals is churn. Executors holding Storage Memory or shuffle blocks are the pinned ones. Two Spark 3.x configs matter: spark.dynamicAllocation.cachedExecutorIdleTimeout defaults to infinity — an executor holding cached blocks is never reclaimed unless you set it — and with spark.dynamicAllocation.shuffleTracking.enabled=true (the usual mode on Kubernetes, which lacks an external shuffle service), executors holding shuffle data survive until shuffleTracking.timeout.
Fix. Set explicit cached/shuffle idle timeouts, unpersist() DataFrames you’re done with, and audit the minimum-workers floor — a min_workers raised during an incident and never lowered is a classic silent cost. For churn, lengthen spark.dynamicAllocation.executorIdleTimeout so executors survive short gaps between stages.
How to measure it. Count the churn cycles: in the Executors tab (or the event timeline), every executor removed and re-requested within a few minutes is one cycle, and each cycle costs startup time plus any shuffle refetch. Executors whose Remove Time is long after their last task finished are the pinned ones — their uptime-minus-task-time gap is directly billed waste.
What do stragglers and data skew actually cost?
A straggler makes every executor in the stage wait: if 199 tasks finish in 1 minute and one takes 20, you billed the whole cluster for 20 minutes to get 1 minute of median work.
Why it burns money. Stage boundaries are barriers: until the last task finishes, nothing downstream starts. The cost of a straggler isn’t its own runtime — it’s (straggler time − median time) × every other executor in the stage. That multiplier is the straggler tax. Skew is the most common cause: one partition with 50× the rows (a null-heavy join key, a whale customer) makes one task the straggler by construction.
Confirm it in the Spark UI. On the stage detail page, read the task duration summary: max at many multiples of median means stragglers. If the same tasks also show outsized Shuffle Read Size / Records, it’s skew; even input sizes with outsized durations point to a slow node instead.
Fix. For skew: AQE’s skew-join handling (spark.sql.adaptive.skewJoin.enabled, on by default since Spark 3.2) splits oversized partitions for supported join shapes; otherwise salt the hot key or repartition — full playbook in the data skew deep dive. For genuine slow-node stragglers, speculation helps, with the caveat two sections down.
How to measure it. The straggler-tax formula runs on numbers the stage summary already gives you: (max task duration − median) × the number of other executor slots in the stage. At the application level, skew shows up as the waste percentage spark-analyzer reports — our deliberately skewed demo job measured 40.8% compute waste, and the stage-level sheet pinned it on the join stage.
How much compute do spill and GC quietly burn?
Spill and GC are runtime multipliers: the stage still succeeds, so nobody investigates, but every affected task runs materially longer than it should — and on Databricks or EMR, longer is the bill.
Why it burns money. Spill means a task’s working set didn’t fit in execution memory, so Spark serialized it to disk and read it back — extra CPU, extra I/O, sometimes multiple passes. GC pressure means the JVM stops your tasks to collect garbage; at 10–20% GC time, one executor in every five-to-ten is doing memory management instead of your query.
Confirm it in the Spark UI. Stage and task metrics have explicit Spill (Memory) and Spill (Disk) columns — any nonzero value is paid-for overhead. The Executors tab shows GC Time per executor; past ~10% of task time it’s worth fixing.
Fix. For spill: raise shuffle partition counts so each task’s slice fits in memory, give each core more memory (fewer cores per executor), and let AQE coalesce the result. For GC: prefer several moderate heaps over one huge one, cut per-task object churn, and move what you can off-heap. Native engines shift memory pressure rather than eliminating memory management — see why native Spark accelerators get OOMKilled.
How to measure it. Sum the Spill (Disk) column across a stage’s tasks for the bytes written twice, and read GC Time as a share of Task Time per executor — 15% GC time means ~15% of that executor’s billed compute went to memory management. Both are visible per stage and per executor in the UI; treat them as runtime multipliers when you translate to cost.
Are speculation and retries running your work twice?
Speculative execution and task retries both mean paying for the same work more than once — by design in the first case, by failure in the second.
Why it burns money. With spark.speculation=true (off by default in OSS Spark), Spark launches duplicate attempts of slow tasks and keeps whichever finishes first; the killed attempt is pure waste. Good trade against flaky hardware, bad trade against skew — a skewed task is slow everywhere, so speculation just runs the slow work twice. Retries are worse: a task that OOMs after 10 minutes and retries 4 times bills ~50 minutes for 10 minutes of progress, and a shuffle fetch failure can rerun an entire stage, including tasks that already succeeded.
Confirm it in the Spark UI. On the stage page, tasks killed with reason “another attempt succeeded” are speculative duplicates you paid for. Failed tasks show per-stage with error reasons; stage reattempts (Stage 12, attempt 1, 2, …) on the Jobs page are the expensive ones.
Fix. Enable speculation only after ruling out skew, and tune spark.speculation.quantile / multiplier to target true outliers. For retries, fix the root cause — memory for OOMs, shuffle stability for fetch failures — instead of raising spark.task.maxFailures and paying the loop.
How to measure it. Add up the durations of tasks killed with “another attempt succeeded” — that total is pure speculative waste. For retries, failed-task durations × attempt counts (both in the stage task table) give the overhead; a stage with reattempts effectively billed you for the stage more than once.
What’s the workflow for finding the waste — on Databricks or anywhere else?
Start with the free sweep, then do forensics only where the numbers say to. Spark Analyzer is a local CLI that reads any Spark History Server — pass --platform dbr (or dbr-photon, emr-spark, gcp-dataproc, azure-fabric) so results are interpreted against the right baseline. In Onehouse’s analyses across organizations, 30–70% of Spark compute is typically wasted on suboptimal configurations and inefficient patterns; this tells you where yours sits.
pip install spark-analyzer
spark-analyzer configure          # point it at your Spark History Server
spark-analyzer analyze --save-local
spark-analyzer report --input spark_analysis_output/<app>.json- Sweep the fleet. Run the analyzer across your History Server. Each application gets a report with resource efficiency, compute waste, and a stage-level breakdown classified as extract/transform/load.
--save-localkeeps every byte in your environment. - Rank by waste. Sort applications by compute-waste percentage — that’s your cost backlog, ordered. We ran this end to end on synthetic waste patterns in the Spark Analyzer walkthrough.
- Do the forensics. For each top offender, use the Spark UI signatures above to name the mechanism — idle executors, churn, skew, spill, GC, speculation, retries — and apply the matching fix.
- Convert to dollars yourself. Wasted compute × your hourly executor rate. The report doesn’t guess your negotiated rates, so it doesn’t print dollars.
- Verify. Re-run the analyzer after the fix; the before/after efficiency numbers make “we optimized it” a measurement, not a feeling. (If the job runs on Quanton, you also get the AI agent for Spark in the Spark UI — it live-monitors the running job, raises Diagnostics alerts automatically for skew, shuffle, OOM risk, executor underutilization, and partition issues, and recommends config and code fixes.)
How do I reduce my Databricks DBU cost?
Your Databricks DBU cost is mechanical: DBUs accrue per hour, proportional to cluster size and instance type, multiplied by the rate for your compute tier (Jobs, All-Purpose, Photon-enabled). So DBU spend ≈ rate × cluster DBU/hour × hours — and everything in this post attacks one of those factors. Reclaiming idle executors shrinks the cluster; eliminating spill, GC, stragglers, and retries shortens the hours. There is no separate “DBU optimization” discipline; it’s waste removal with a billing unit attached.
Then there’s the rate itself. Photon buys speed by raising the DBU multiplier, so check whether the speedup outruns the premium for your workloads — sometimes it does, often it’s a wash.
Quanton attacks the rate differently: pricing is per GiB of data processed, not per compute-hour — from $0.0009/GiB read ($0.0018 write) down to $0.0003/GiB at the top band, first 100 GiB every month free. Per-GiB pricing means a faster engine cuts your EC2 hours while the platform fee stays flat. On the full TPC-DS 10 TB suite (all 99 queries, same 11-node cluster), Quanton finished 6.5% faster than Databricks Photon on DBR 18.2 with a platform fee of $5.27 versus $15.67 in Photon DBU fees — 66% lower on identical hardware. Across Photon and EMR, that works out to 3–5× better price/performance. Full methodology and rate table on the pricing page.
What about EMR cost optimization?
EMR cost optimization is the same waste hunt with simpler billing: EMR charges EC2 instance-hours plus a per-instance EMR uplift, so every executor-second reclaimed converts to savings at your raw instance rate — no DBU multiplier in the way.
That directness cuts both ways: there’s no rate tier to renegotiate, so the only levers are cluster size and runtime — which makes engine speed the dominant one. Everything above applies unchanged, and because runtime maps linearly to EC2 hours, a faster engine is a direct discount: Quanton runs Spark and SQL jobs up to 4× cheaper on the same instances. If you run Spark on EMR today, start with the Executors-tab utilization check — clusters provisioned by instance-count folklore are routinely the worst over-provisioning offenders.
How do I right-size a Spark cluster?
Right-sizing is measurement, then dynamic allocation: measure the job’s real sustained parallelism (task time ÷ uptime across executors), size the floor to that, and let dynamic allocation handle the peaks instead of provisioning for them.
The failure modes — pinned executors, churn, timeouts that never fire, maxExecutors left unbounded — get their own post: the Spark dynamic allocation deep dive. Read it next if your Executors tab looks like a sawtooth.
Takeaway
Databricks cost optimization isn’t a procurement exercise — it’s an engineering one with a billing unit. The waste has names (idle executors, DA churn, straggler tax, skew, spill, GC, speculation, retries), each has a Spark UI signature, and each is measurable in executor-seconds. spark-analyzer measures the waste per application from your History Server — free, local, on any platform; you multiply by your own rates; the fixes are ordinary Spark engineering. Do the waste hunt first — then decide whether the remaining spend justifies a faster, cheaper engine, remembering the platform-fee comparison above was measured, not modeled.
