
Overview
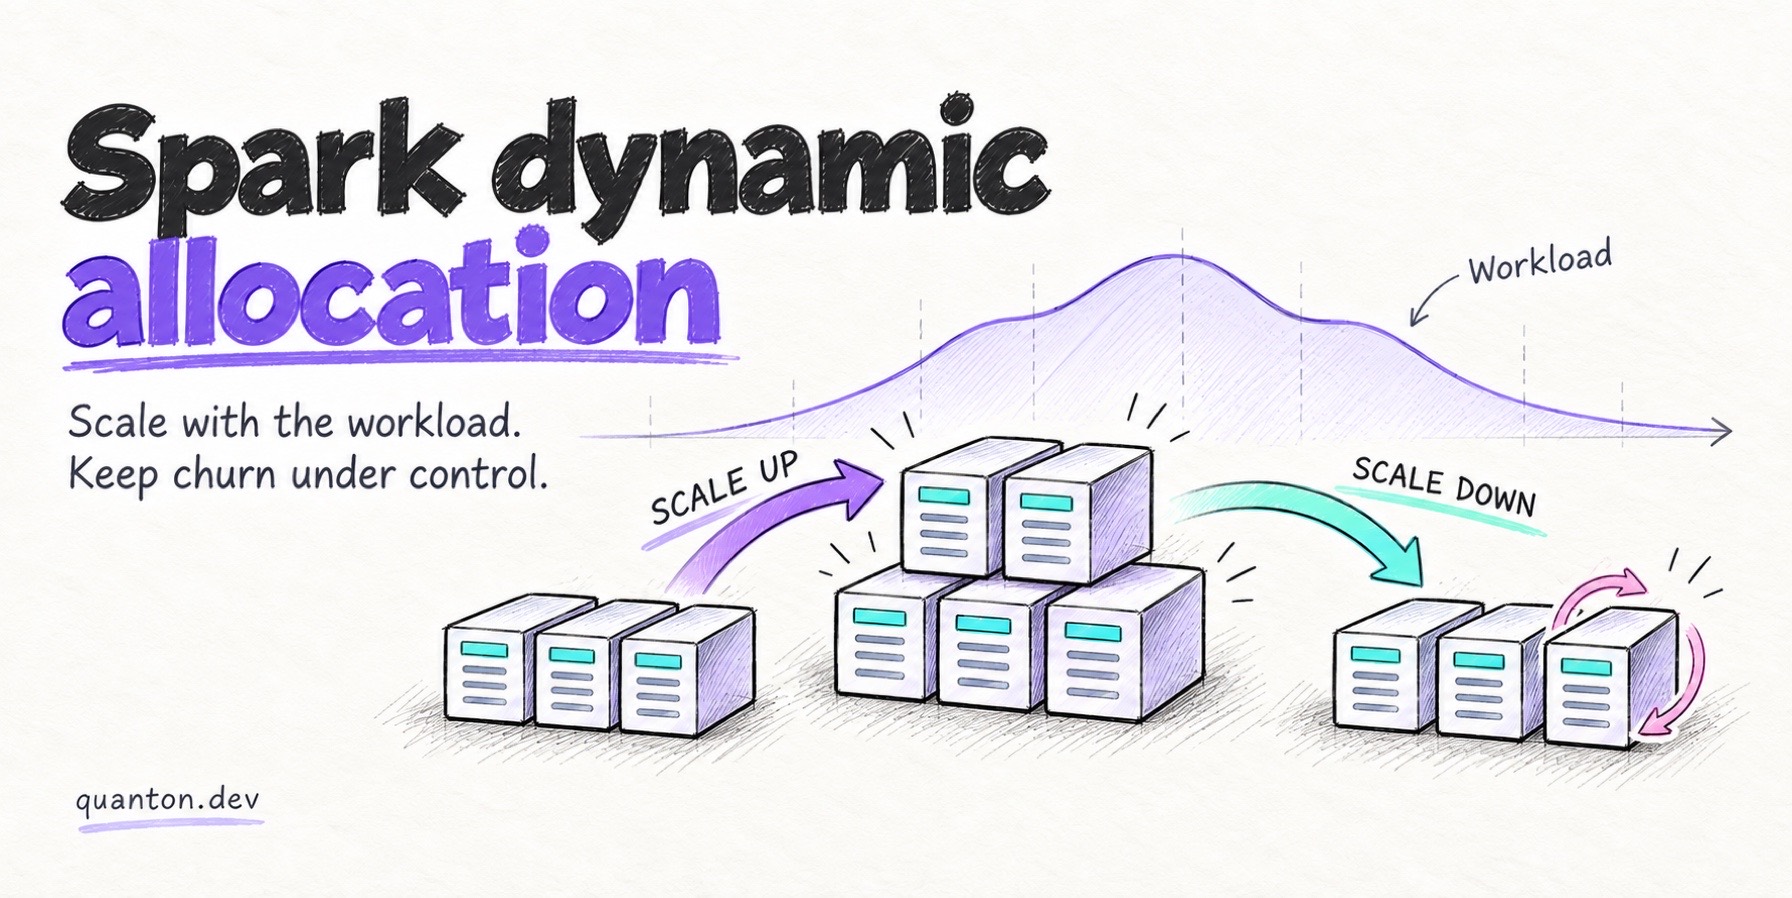
Spark dynamic allocation (spark.dynamicAllocation.enabled) lets an application grow and shrink its executor fleet at runtime instead of holding a fixed size from submit to finish. On bursty workloads — ETL with wide parallelism swings, shared clusters, interactive notebooks — it reclaims real money. On the wrong workload, or with default timeouts, it produces the two most common complaints in Spark cost threads: the cluster never scales down, and executors churn so fast the job gets slower and more expensive.
This post covers the mechanism, the configs that matter, the scale-down failure modes, and how to measure what dynamic allocation is actually costing you. It’s part of our broader Spark performance tuning guide.
How does Spark dynamic allocation work?
Dynamic allocation is a control loop in the driver: it requests executors when tasks are backlogged and releases executors that sit idle. Two policies, two sets of timeouts.
Request policy — exponential ramp on backlog. When there have been pending tasks for spark.dynamicAllocation.schedulerBacklogTimeout (default 1 s), the driver requests executors. If the backlog persists, it requests again every sustainedSchedulerBacklogTimeout, and the number requested per round grows exponentially: 1, 2, 4, 8, … until the backlog clears or maxExecutors is hit. The design intent: probe cautiously in case a couple of executors suffice, but reach full size in a handful of rounds when they don’t. The consequence: a big stage landing on a scaled-down application waits several rounds — plus container/pod startup time per round — before it has the parallelism it needs.
Release policy — idle timeout. An executor with no running tasks for spark.dynamicAllocation.executorIdleTimeout (default 60 s) is released. Separate, stricter rules apply to executors holding state (next paragraph) — and this is where scale-down usually breaks.
The shuffle problem. A removed executor takes its local shuffle files with it. If a downstream stage still needs that map output, Spark must recompute it — so the driver refuses to release executors that hold live shuffle data. Historically the fix was the external shuffle service (spark.shuffle.service.enabled=true): a per-node daemon on YARN or standalone that serves shuffle files independently of executor lifetime, making every executor safely removable. Kubernetes has no external shuffle service, so the standard path there is shuffle tracking (spark.dynamicAllocation.shuffleTracking.enabled): the driver tracks which executors hold shuffle data for active jobs and only releases those that don’t. Shuffle tracking spent the 3.x line as an experimental, explicitly-set option; in Spark 4.0 it is on by default. Set it explicitly rather than relying on your release’s default. (Spark 3.1+ also offers graceful decommissioning with shuffle-block migration — spark.decommission.enabled — which moves the blocks instead of pinning the executor.)
What are the key spark dynamic allocation settings?
Eight configs do almost all the work:
Config (spark.dynamicAllocation.) | What it does | Default | Sane starting point |
|---|---|---|---|
enabled | Master switch | false | true for bursty/multi-stage work |
minExecutors | Floor the app never drops below | 0 | 0–2; nonzero only if first-stage latency matters |
maxExecutors | Ceiling for the ramp | infinity | Set explicitly — match your largest stage’s real parallelism |
initialExecutors | Starting fleet at submit | = minExecutors | Raise for jobs that start heavy, to skip the ramp |
executorIdleTimeout | Release executors idle this long | 60 s | 60–120 s; raise if you see churn |
cachedExecutorIdleTimeout | Same, for executors holding cached blocks | infinity | Finite (e.g. 30 min) on any job that calls .cache() |
schedulerBacklogTimeout | Backlog age before first request | 1 s | Keep 1 s; raise to damp reaction to tiny spikes |
shuffleTracking.enabled / shuffleTracking.timeout | Dynamic allocation without an external shuffle service | on by default in 4.0 / timeout infinity | true on K8s; give the timeout a finite value (e.g. 30 min) |
A reasonable Kubernetes baseline:
spark.dynamicAllocation.enabled=true
spark.dynamicAllocation.minExecutors=0
spark.dynamicAllocation.maxExecutors=40
spark.dynamicAllocation.initialExecutors=4
spark.dynamicAllocation.executorIdleTimeout=120s
spark.dynamicAllocation.cachedExecutorIdleTimeout=30min
spark.dynamicAllocation.schedulerBacklogTimeout=1s
spark.dynamicAllocation.shuffleTracking.enabled=true
spark.dynamicAllocation.shuffleTracking.timeout=30min
Numbers are starting points, not answers — maxExecutors=40 is right for a stage with ~150–200 tasks on 4–5 core executors and wrong for most other shapes. One K8s-specific note while you’re sizing executor pods: if you run a native accelerator, remember its memory lives off-heap, and pods sized for heap alone get OOMKilled.
Why is my Spark cluster not scaling down?
Because something is pinning the executors, and the pins are invisible in the config you tuned. Four causes account for nearly every case:
- Cached RDDs/DataFrames. An executor holding cached blocks is governed by
cachedExecutorIdleTimeout, notexecutorIdleTimeout— and the default is infinity. One.cache()early in a notebook, and every executor that stored a block is retained forever, “idle” tab notwithstanding. Set a finite value, orunpersist()when you’re done. - Shuffle data with no timeout. With shuffle tracking on, executors holding shuffle output for active jobs are held until the data is unneeded.
shuffleTracking.timeoutdefaults to infinity, so long-lived applications (Thrift server, streaming, interactive sessions) accumulate pinned executors across jobs. Give it a finite timeout. - Long-tail stragglers. Scale-down requires idle executors. A skewed stage where 199 of 200 tasks finish in a minute and one runs for forty keeps every executor with a residual task alive — and with the default infinity timeouts, the rest stay pinned too. That’s a data skew problem wearing an autoscaling costume.
- minExecutors set too high. Someone set a floor of 20 during an incident and it’s still in the job template. The cluster is “not scaling down” because you told it not to.
Databricks users hit the same wall with different phrasing — “Databricks autoscaling not scaling down” — and mostly the same causes: cached data and shuffle files pin workers, so the control plane can’t remove nodes. The knobs differ (it’s cluster-level, not spark.dynamicAllocation.*), the mechanism doesn’t. If that’s your stack, the Databricks cost optimization guide covers it in its own terms.
When does dynamic allocation waste more than it saves?
When the cost of moving executors exceeds the cost of keeping them. Three patterns:
- Executor churn. A workload that alternates busy and quiet on a period close to
executorIdleTimeoutreleases executors every lull and re-requests them seconds later. Each cycle burns pod/container startup and JVM warm-up, and if a released executor held shuffle output that later proves needed, Spark recomputes or refetches it — the job pays twice for the same map work. The fix is boring: raiseexecutorIdleTimeoutuntil the fleet stops oscillating, or pinminExecutorsat the workload’s steady-state trough. - Ramp-up latency on short jobs. A 3-minute job that spends 40 seconds walking the exponential ramp (plus pod scheduling per round) has donated a fifth of its runtime to autoscaling. For short, predictable batch jobs, a fixed executor count — or a generous
initialExecutors— beats dynamic allocation outright. - Over-eager maxExecutors amplifying skew. Uncapped, one backlogged stage ramps to a huge fleet; then the skewed long tail arrives and hundreds of executors idle behind one straggler. Dynamic allocation multiplied the waste: more executors waiting on the same slowest task. Cap
maxExecutorsat real parallelism and fix the skew at the source.
How do I see what dynamic allocation is actually costing me?
Measure it in executor-seconds — capacity allocated versus capacity doing useful work. The Spark UI shows you executor counts over time; it doesn’t total up what the oscillation cost. Two numbers get you there:
- Idle ratio. In the Executors tab, sum Task Time and divide by summed executor uptime. The gap is billed capacity that ran no tasks — the direct cost of pins, floors, and slow release.
- Churn count. In the executor timeline, each release-then-re-request cycle within a few minutes is one churn event; multiply by your executor startup time (plus any shuffle refetch) for the overhead dynamic allocation added.
One honesty note: these are executor-seconds, not dollars, because only you know your instance pricing. The bridge is one multiplication — executor-seconds × your hourly per-executor rate (instance cost ÷ executors per instance). Do it once for your top job and you’ll know whether tuning dynamic allocation is a rounding error or a line item.
Can you do better than the default autoscaler?
Yes — and the industry keeps re-learning that the default one isn’t enough. Spark’s dynamic allocation scales on task backlog, not on what actually matters — CPU and memory utilization or data volumes. Databricks concluded this back in 2018 and replaced Spark’s algorithm with its own optimized autoscaling that tracks executor utilization to scale down aggressively without hurting running jobs. The failure they were fixing is the one this post has been describing: a reactive, backlog-driven loop that’s slow to release capacity and contradictory to tune.
For lakehouse workloads, Onehouse rebuilt the autoscaler on the same diagnosis — why Spark’s autoscaler fails your lakehouse, and how we fixed it walks through a production case where a cluster sat at 24 executors for over ten hours while CPU utilization fell from 55% to 15%. The Onehouse Compute Runtime autoscaler scales on multiple signals — CPU and memory utilization, estimated pending-task growth, workload and source statistics, and shuffle data volume — downscales on sustained low load instead of idle timeouts (while preserving intermediate data), and offers aggressive or conservative scale-up modes per workload. On some ETL workloads that’s measured out to 2–3× lower job runtimes and 3–5× lower compute costs versus default dynamic allocation.
So tune the configs in this post first — they’re free and they fix the worst of it. But if your fleet is large enough that autoscaler waste is a line item, know that the ceiling isn’t “tuned defaults”; it’s a smarter control loop.
How do I audit utilization across every job, not just this one?
For a fleet-wide sweep, run Spark Analyzer — Onehouse’s free CLI — against your Spark History Server. Each application gets a report with resource efficiency (compute used vs. allocated) and compute waste percentages: a direct, before/after-friendly measurement of what your dynamic allocation settings actually deliver.
pip install spark-analyzer
spark-analyzer configure          # point it at your Spark History Server
spark-analyzer analyze --save-local
Everything runs locally with --save-local. Real example output is in the Spark Analyzer walkthrough.
Takeaway
Spark dynamic allocation is a good default for bursty workloads and a bad one for short uniform jobs. Its failure modes are all pins and oscillation: infinite cachedExecutorIdleTimeout, infinite shuffleTracking.timeout, stragglers holding the fleet, and churn on spiky load. Set the ceilings and timeouts to finite, workload-shaped values, use shuffle tracking on Kubernetes, and measure the result in executor-seconds before and after — not in vibes. And when tuned defaults still leak, remember the ceiling is a smarter control loop, not a better timeout.
