Exercise 2: Use Agentic AI
The Quanton operator ships an embedded AI agent — opened from the AI Agent button in the top-right of the Spark Web UI's navbar. It has full live context — stages, tasks, SQL plans, executor metrics — and answers questions in plain English. The operator install in Exercise 1 already has the agent enabled (onehouseConfig.enableAIAgent=true).
The same repo includes a self-contained TPC-DS-with-agent example tuned for minikube — bigger workload than the standard benchmark, so the agent has interesting things to reason about (1000+ stages, 99 queries, real shuffle and join activity).
cd examples/tpcds-agent
./run.sh                           # default — SF=10, ~10–15 min datagen, ~8–30 min queries
# or for a quick demo:
SCALE_FACTOR=1 ./run.sh            # ~3–5 min datagen, ~2–3 min queries
When the script reports Driver is Running, port-forward and open the UI:
# after ~1 minute - in a different terminal window
kubectl port-forward quanton-tpcds-agent-driver 4040:4040 -n default
# open http://localhost:4040
Note: If this is the first time you are running 10GB TPCDS benchmark with this setup (very likely), the datagen will take roughly ~10 minutes to complete. If you want a quick test, run with scale factor 1 i.e.
SCALE_FACTOR=1 ./run.sh
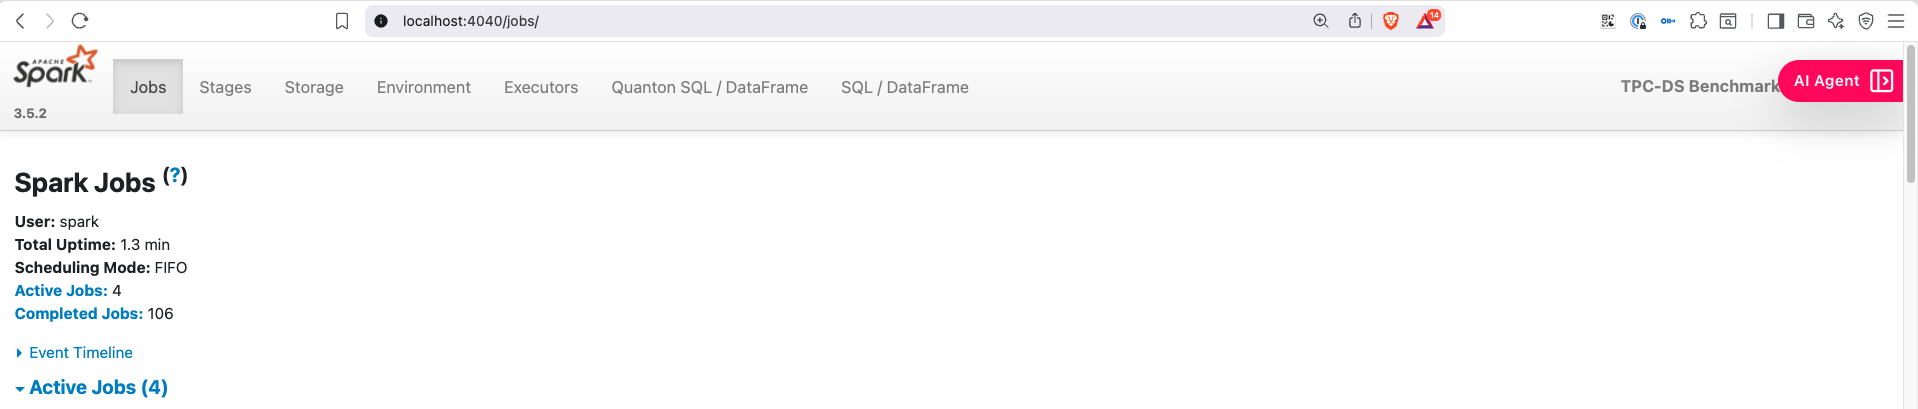
Open the AI Agent
Click the AI Agent button in the top-right of the Spark UI navbar.
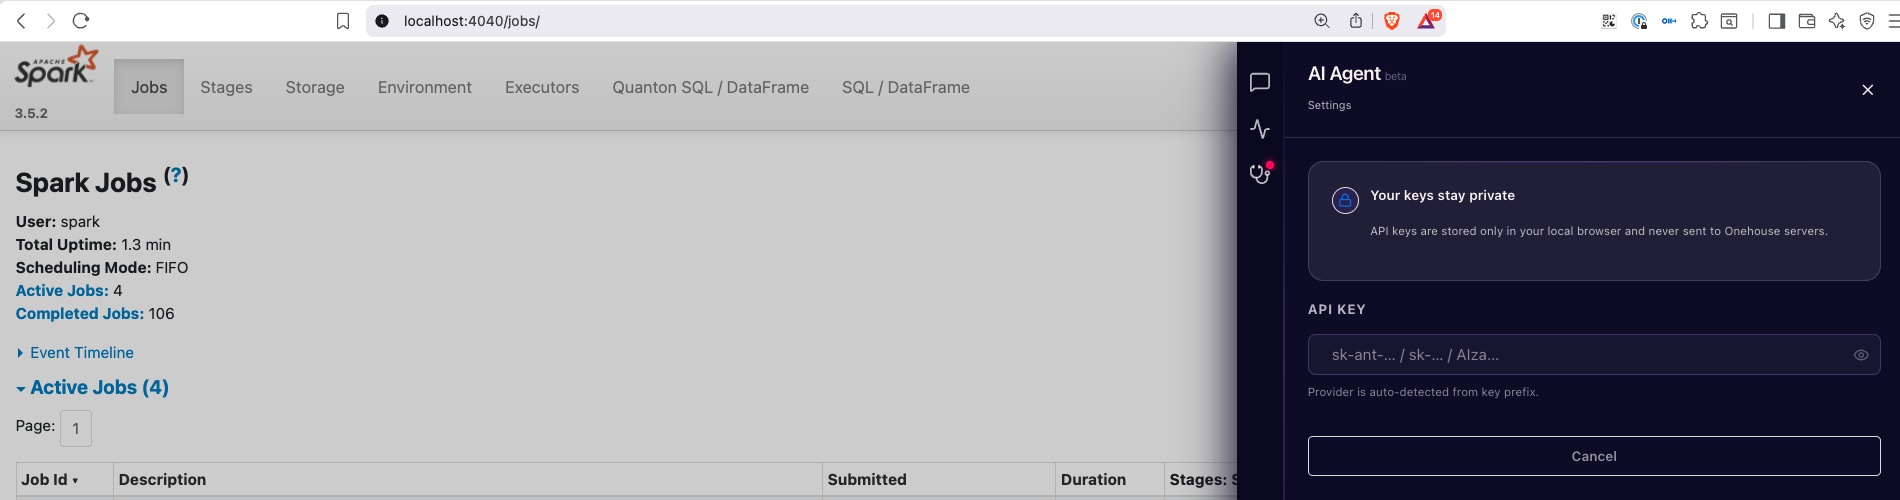
Add your API key
In the Settings tab, paste your Anthropic / OpenAI / Gemini API key. The key is stored in browser local storage — never sent to Onehouse.
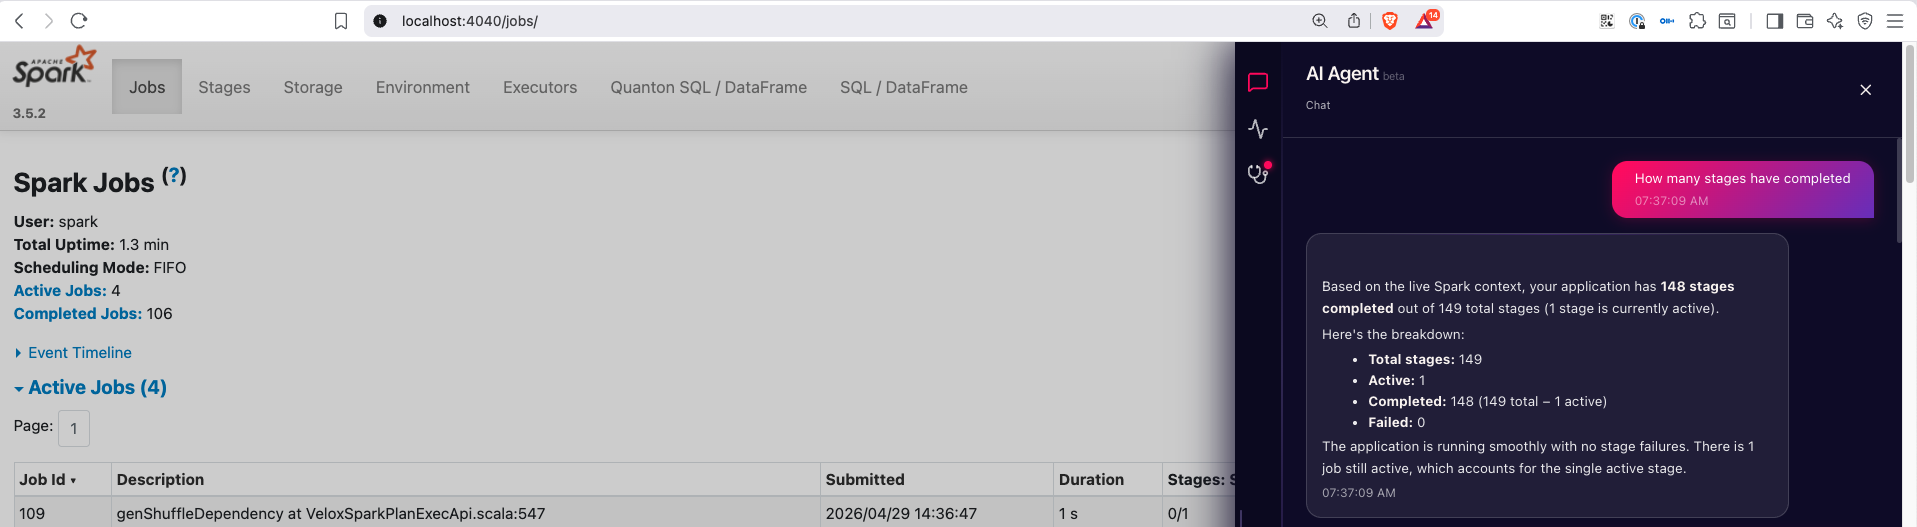
Ask the agent questions
Switch to the Chat tab and start asking questions about the live job:
"How many stages have completed?" "Which executor has the highest GC time?" "What's the most expensive query in this run?"
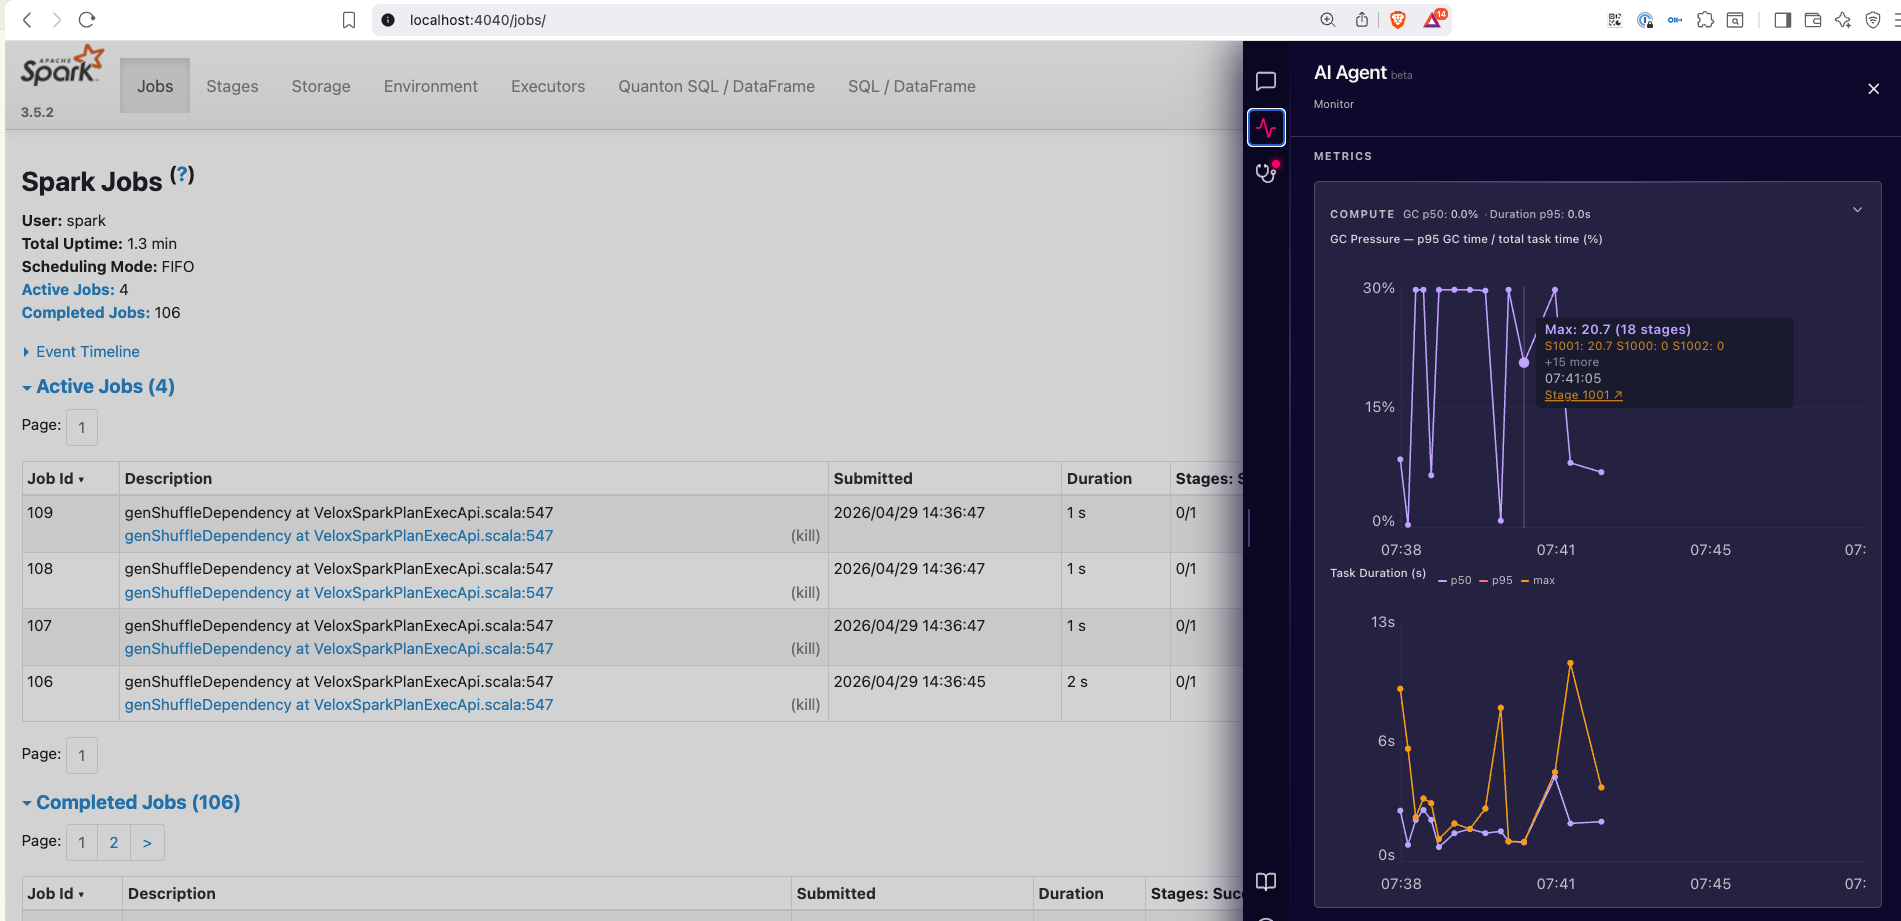
Live diagnostics and monitoring
The Monitor tab surfaces live skew, spill, GC pressure, and per-executor metrics — all the stuff you'd normally piece together from multiple Spark UI tabs.
See the Agentic AI page for what each tab covers in detail, including the Diagnostics and Recommendations tabs.